October 2025 | ![]() 11 min read | Download PDF
11 min read | Download PDF
Ben Chan, BComm, BEng (Hons), CFA
Portfolio Manager
Tim Hall, BComm
Portfolio Manager
Leo Barry, BSA, MBA
Portfolio Manager
The past three years have been a tough time for Australia’s small, listed companies as they have been significantly outperformed by their large capitalisation (cap) counterparts owing to the stellar performance of some household names.
However, for ardent small companies investing advocates, like us, we believe the case for small companies investing has strengthened in recent times due to several broad themes:
- Small caps offer exposure to companies in the earlier stage of their life cycle, and as such, we believe the opportunity exists to deliver higher growth rates than their larger counterparts.
- A falling interest rate environment has historically coincided with periods of strong small cap performance.
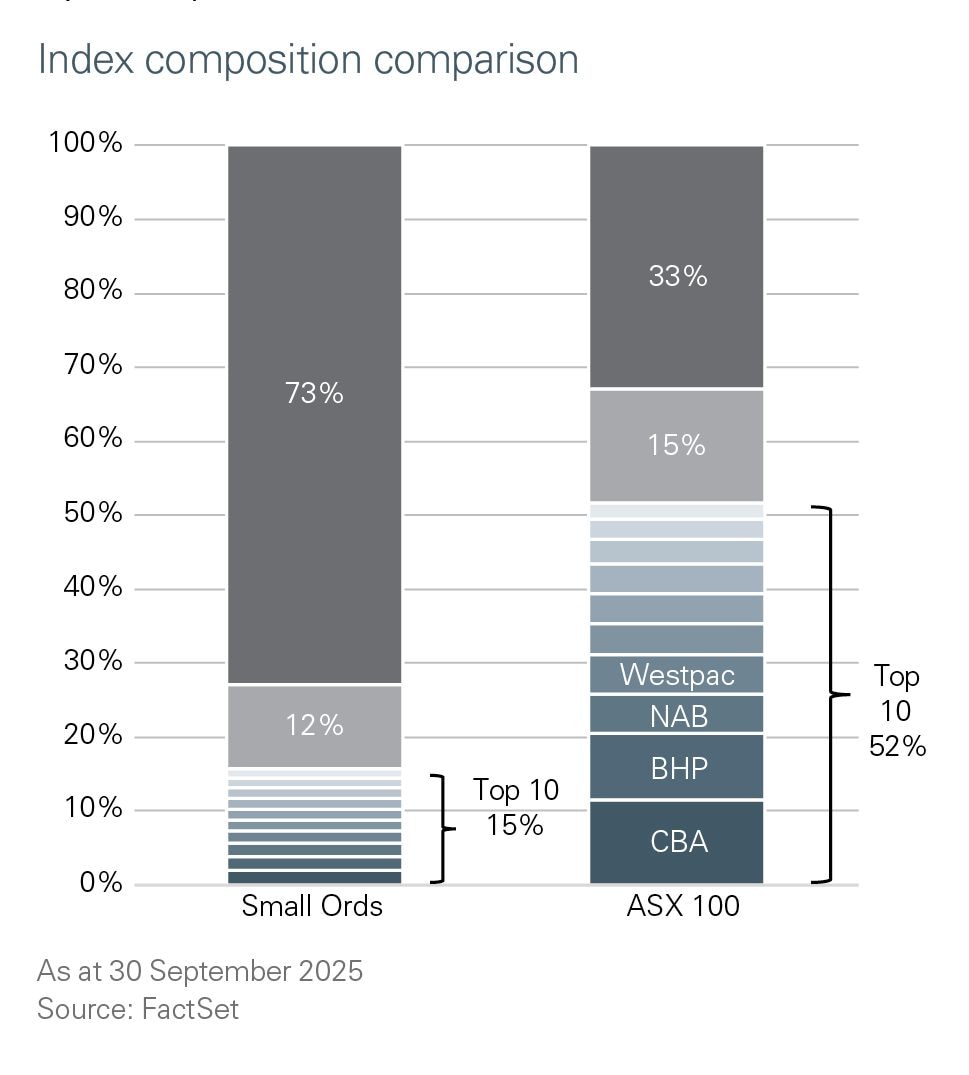
- The S&P/ASX Small Ordinaries Index (Small Ordinaries Index) is much more diversified (Chart 2) with the top 10 stocks by market capitalisation representing only 16%) vs the S&P/ASX 100 Index (ASX 100 Index) top 10 companies by market capitalisation representing a whopping 52% and the Big 4 banks 26%).1
In our view, the Small Ordinaries Index’s greater diversification means that active managers don’t end up having to waste valuable portfolio space on stocks on which they have a negative fundamental view simply for risk mitigation reasons, as is the case when performance is benchmarked against large cap dominated indices like the S&P/ASX 200 Index (ASX 200 Index).
- A diversified small caps fund, in our view, complements ‘blue chip’ direct holdings that form a large part of many investors’ portfolios.
- There is evidence that the small cap domain is especially rewarding for active investing as it is under researched (less sell-side coverage) and thus it is possible to uncover promising companies at attractive valuations before they are discovered by the broader investment community.
- Flows from passive investors can significantly boost long-term returns by identifying companies early in their lifecycle. As these companies move through various stages of index inclusion, they attract more liquidity.
The most recent August-ending reporting season validated many of the points above with the Small Ordinaries Index having its best month relative to large caps (ASX 100 Index) in over three years, outperforming by around 6%. This was followed up by a 5% outperformance in September (Chart 1).
Chart 1: Small companies had their best relative performance against the S&P/ASX 100 Index in over 3 years
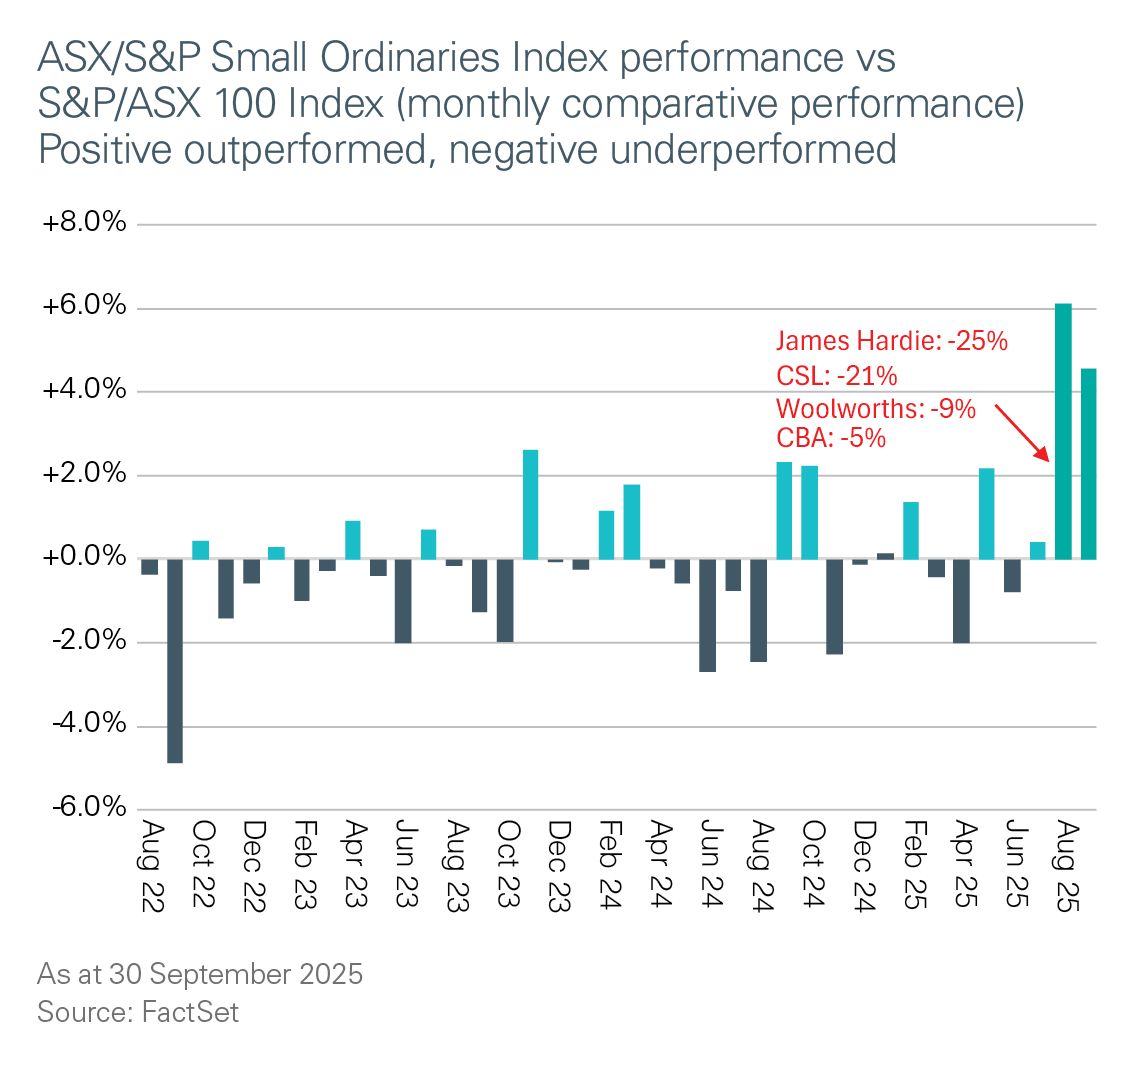
This relative performance in August especially was aided by stumbles for some of the more prominent ASX 100 stocks which have historically been good long-term compounders such as Commonwealth Bank of Australia (CBA) (-5%), James Hardie (-25%), Woolworths (-9%) and CSL (-21%).2
However, small companies’ outperformance owed not just to smalls' performance being less bad than that of the ASX 100: the ASX Small Ordinaries Index returned 8.4%, a healthy absolute return, in our view.3
As Chart 2 makes plain, the top 10 stocks in the ASX 100 make up a whopping 52% of the index by market capitalisation (the Big Four banks alone represent 26%) versus a much lower 15% in the Small Ordinaries Index.
Chart 2: ASX 100 Index is much more dominated by its top 10 stocks versus Small Ordinaries Index
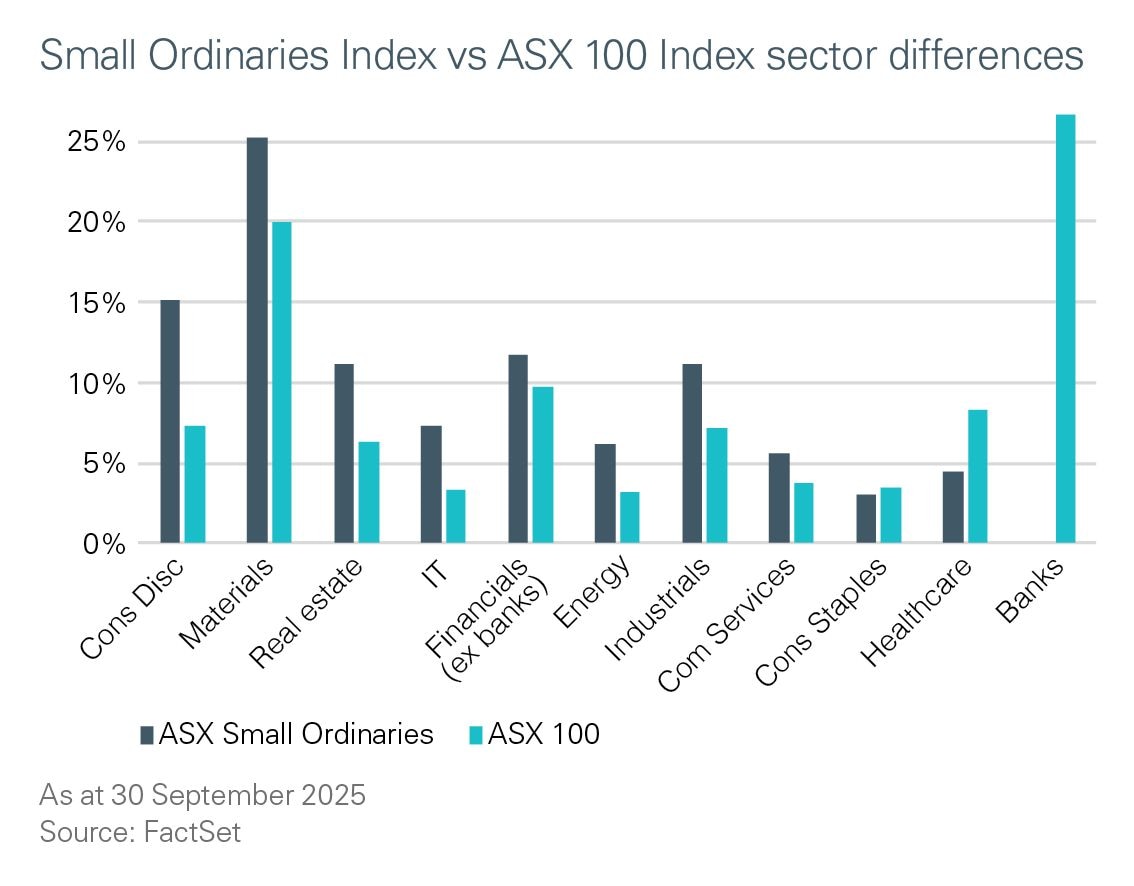
The ASX 100 Index’s extraordinary concentration, especially that of banks (Chart 3), by global standards, means that even a negative view by a manager on any of the benchmark’s largest companies would likely still result in a large holding to mute the danger of underperformance risk.
This is not the case in small companies, where there is no stock large enough to dictate such a requirement. By inference, this means there is potential for greater active management and alpha in the small caps realm as it is meaningfully more diversified and less concentrated than the top-heavy ASX 100.
Chart 3: Banks are such a large part of the ASX 100
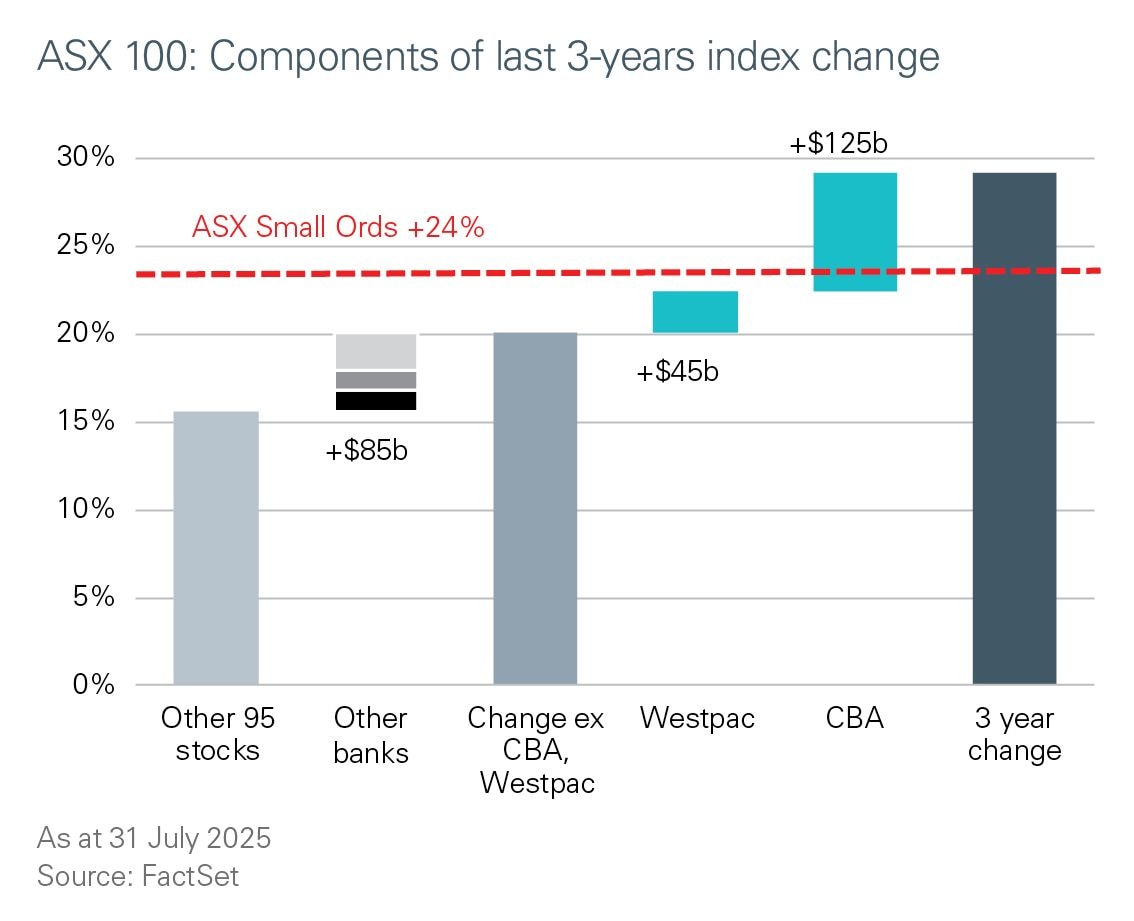
For the 3 years up to the end of July 2025 (the last month before what we hope is the start of a much more prolonged reversion), headline index returns show that large caps outperformed smalls by 5.6%.4 Over this period, CBA accounted for about 7% of the ASX 100 Index’s 29% return (Chart 4). If CBA had delivered a flat return, the Small Ordinaries Index would have outperformed the ASX 100 Index.
This context is important as headwinds that historically have challenged small companies — high inflation, hikes in official interest rates, and geopolitical uncertainty — featured over the past three years.
To us, the fact that small companies, in aggregate, performed as well as they have through a hostile period underscores the underlying quality of the companies in the Small Ordinaries Index.
Chart 4: CBA made an outsize contribution to ASX 100 Index’s return
There’s been plentiful public commentary on CBA’s stellar recent years performance, and its high valuation against local as well as global peers, and so we don’t intend to repeat well-known details here. That said, we think the issue deserves some comment as it relates to comparisons with the small cap index.
The conglomerate Wesfarmers, where Bunnings contributes around 60% of group earnings, should also be added to the conversation to underscore the sway a handful of companies can have on index returns.
CBA and Wesfarmers rank among Australia’s top-quality businesses. But have their market positions or outlooks shifted enough in the past three years to justify their share prices surging 73% and 84%, respectively?CBA delivered a 5% per annum increase in earnings per share (EPS), Wesfarmers 6% per annum between FY22 and FY25, and current market expectations are for CBA to report 2% per annum EPS growth over the next 3 years, and Wesfarmers a 10% per annum.
In our view, these earnings outlooks, in isolation, make it difficult to justify the implied around 50% valuation multiple expansions associated with these two companies (Chart 5).
Chart 5: CBA, Wesfarmers, and the ASX 100 have benefited from significant valuation expansion
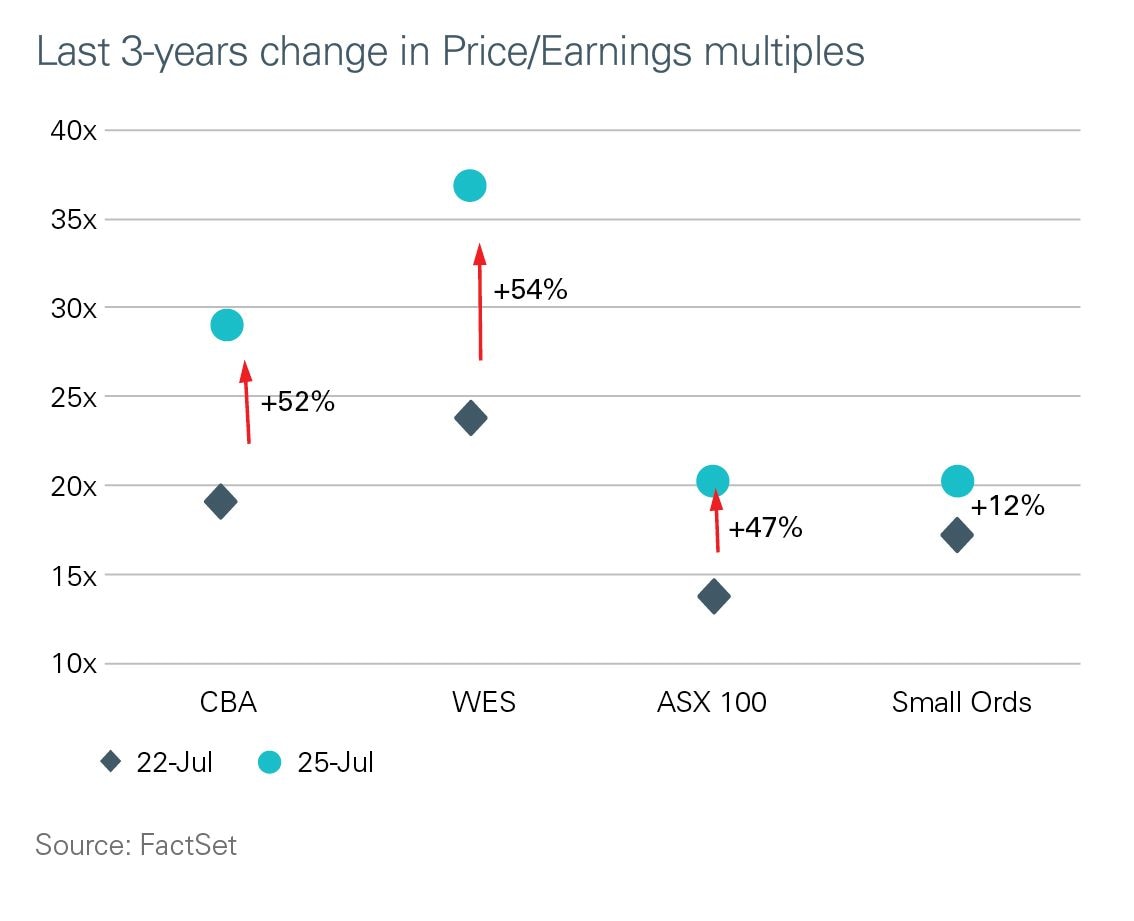
We highlight these stocks because their size gives them bellwether status in the ASX 100 Index, attracting significant passive investor fund flows. This, in our view, drove their valuations beyond levels justified by actual and projected EPS growth.
In our view, both stocks were great beneficiaries of fund flows, including from index-tracking investors who kept adding to their holdings as the companies’ market capitalisations grew. This created a momentum-buying feedback loop that become unmoored from judgments over their future operational performance and earnings prospects.
To us, investing is about making positive as well as negative judgements about companies. However, in highly concentrated indices like the ASX 20, ASX 100, and ASX 200, investment managers whose performance is benchmarked against large cap dominated indices are almost obliged to hold the shares of the biggest companies on fear of potential underperformance relative to benchmark returns.
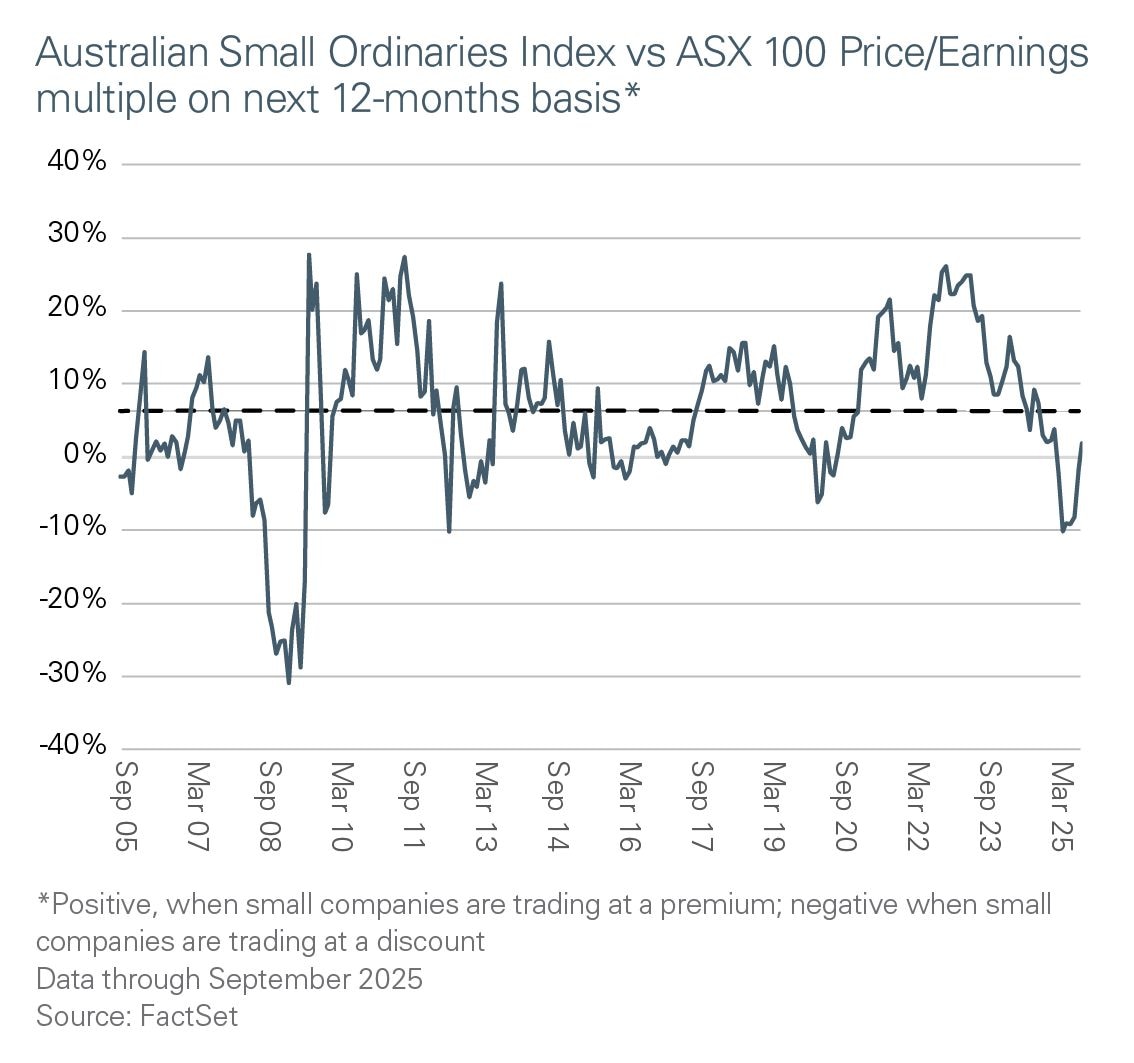
Small companies have not experienced the same degree of valuation appreciation with the Small Ordinaries Index’s Price/Earnings multiple only having increased by around 12-20x and thus small companies have been trading at a discount to large cap stocks (Chart 6).
Chart 6: Small companies have been trading at a valuation discount to large caps
As we see it, the starting point for small caps’ performance, on both an absolute and relative basis, currently appears sound and the anticipated tailwind of further official cash rate cuts (both in Australia and the US) is still to come. Historically, small caps have outperformed in a rate cutting cycle.
Lower interest rates have benefited small companies in outsize fashion in direct and indirect ways. That’s because small companies are less mature in their life cycles, implying they have significant room to expand their operations, customer base, and revenue.
Moreover, they need capital to grow. Capital, in turn gets deployed to fund either new physical expansions (such as a manufacturing plant and equipment), or marketing to increase awareness.
Falling interest rates reduce the cost of capital and generally improve its access facilitating a higher level of investment to pursue growth opportunities. This increased investment capacity allows small companies to innovate quickly, adapt to market changes, and seize emerging opportunities that larger firms might overlook or be too slow to act on.
Improved borrowing capacity (from lower interest rates) also helps companies going the other way. It’s the nature of capitalism that some stocks will fall out of the ASX 100 owing to operational struggles, whether structural or cyclical.
Lower interest rates ease financial strains on companies with stressed balance sheets. This often boosts their valuations, as potential equity raises to repair balance sheets are at least delayed.
There’s also a more technical reason for why lower interest rates can be a greater tailwind for small companies: lower interest rates increase the value of companies’ future cash flow, when measured in present day terms.
In our experience, this phenomenon is especially beneficial for small, early-stage companies as their starting lower valuations, relative to larger companies, generally results in smaller companies’ valuations appreciating by greater magnitudes than large company valuations.
Even if small companies may not be earning more in the near-term, on the back of lower interest rates, investors tend to assign greater valuation multiples on the expectation they will, in our experience.
Small companies are worth a look
While there are many strong and attractive businesses within the ASX 100 Index, they are not necessarily lower risk — rather, they face different types of risks, in our view.
Their stability and established positions do not make them immune from investors’ expectations for earnings growth and capital appreciation. Given their size, they can face growth constraints simply because they are closer to the market saturation point in their respective industries. This size can limit flexibility, and without a usually risky and expensive acquisition or strategy pivot, growth tends to be incremental rather than spectacular.
By contrast, small companies can benefit from undiscovered value, as they are less likely to be fully priced by investors, given a lack of history. This, we believe, gives investors the potential for outsized returns if the company executes well in its core operations and scales successfully.
We would describe these as enduring reasons for small caps investing and recent data has fortified our views about small companies’ return potential.
Unsurprisingly, we are strong small company investing advocates. While the journey involves inevitable ups and downs, we believe small-company exposure has a rightful place in diversified portfolios — especially considering their superior alpha generation potential.
Like any investment with a higher return potential, small companies investing is best suited to investors with long-term horizons and higher tolerance for risk.
1As at 31 July 2025. Source: FactSet
2As at 31 August 2025. Source: FactSet
3Ibid
4Ibid
Important information
This communication is issued by MLC Investments Limited ABN 30 002 641 661, AFSL 230705 (‘MLCI’), the responsible entity of, and the issuer of units in, the Fairview Equity Partners Emerging Companies Fund, ARSN 133 197 501 (the ‘Fund’). MLCI has appointed Fairview Equity Partners Pty Ltd (‘Fairview’), ABN 45 131 426 938, AFSL 329052, a specialist Australian small company equities manager, as investment manager of the Fund. Fairview is majority owned by its investment team, with a minority interest being owned by the Insignia Financial group (comprising Insignia Financial Ltd ABN 49 100 103 722 and its related bodies corporate) (‘Insignia Group’).
This communication is general in nature and does not take into account any investor’s particular objectives, financial situation or needs. Investors should, before acting on information in this communication, consider its appropriateness, having regard to their own objectives, financial situation and needs.
An investor should consider the current Product Disclosure Statement for the Fund (‘PDS’) in deciding whether to acquire, or continue to hold, units in the Fund. A Target Market Determination for the Fund is also required to be made (‘TMD’). A copy of the PDS and TMD are available from www.mlcam.com.au or by calling our Client Services Team on 1300 738 355.
Past performance is not a reliable indicator of future performance. Returns are not guaranteed and actual returns may vary from any target returns described in this communication. Any projection or other forward-looking statement (‘Projection’) in this communication is provided for information purposes only. No representation is made as to the accuracy or reasonableness of any such Projection or that it will be met. Actual events may vary materially.
The capital value, payment of income and performance of any financial product offered by any member of the Insignia Group is not guaranteed unless expressly stated in a PDS. An investment in any product offered by any member of the Insignia Group is subject to investment risk, including possible delays in repayment of capital and loss of income and principal invested.
Any opinions expressed in this communication constitute our judgment at the time of preparation and are subject to change. We consider any estimates, opinions, conclusions or recommendations are reasonably held or made at the time of preparation. However, no warranty is made as to their accuracy or reliability (which may change without notice) or in relation to any other information contained in this communication and neither Fairview nor any other Insignia Group member accept any liability for any loss arising from its use. In some cases, information has been provided to us by, or obtained from, third parties. While it is believed the information is accurate and reliable, the accuracy of that information is not guaranteed in any way. This communication is directed to and prepared for Australian residents only.