June 2025 | ![]() 13 min read | Download PDF
13 min read | Download PDF
Gareth Abley and Jehan Sukhla, Co-heads of MLC Alternative Strategies
ILS Series: Issue 2
Introduction: From discovery to deployment
In our previous article, we explored why one of the most attractive asset classes we had discovered in our 18 years of managing alternative portfolios is natural catastrophe reinsurance for property, often known as insurance-linked securities (ILS). There are two key reasons for this.
a) Compelling reasons why a risk premium is likely to sustainably exist Homeowners need insurers (to hedge against the risk of ruin), and insurers need reinsurers (to hedge against the undiversifiable risk of natural catastrophes).
Ultimately, both industries need to make a profit to be in business and provide the service to homeowners. ILS investors can co-participate with reinsurers in providing capital and capture this long-term risk premium.
b) Uncorrelated return drivers i.e. weather driven natural catastrophes as opposed to conventional market drivers such as interest rates, GDP growth, multiples.
This is conceptually simple. It’s also rare in the world of investing where asset classes with fundamentally strong and orthogonal return drivers are elusive. What we want to share in this article are some of the key perspectives we’ve formed through our 18 years investing in ILS on how best to invest in this arena.
The reality is not all investors have had a great experience. It turns out that the nuances of how you design and implement an ILS strategy can make a huge difference to both returns and whether you stay invested in the asset class. We believe the latter point is under-appreciated and essential in being able to capture cyclically higher spreads when they arise (as is the case today).
We will cover:
- Why skewing to ‘peak perils’ is compelling.
- The case for targeting more remote risks.
- The merits of both private reinsurance, and publicly traded catastrophe (cat) bonds.
- Why luck dominates skill and the implications for manager selection.
- The importance of staying in the game.
1. The case for peak perils: An anomaly hiding in plain sight
One of the challenges of mainstream investing is that markets are pretty efficient. If P/E multiples in equities are high and high yield spreads are tight, it’s invariably because the economic outlook is good (and vice versa).
ILS is very different. Firstly, as an asset class in aggregate, returns are driven by the reinsurance pricing cycle which acts somewhat independently of markets. For example, spreads in the last two years have been very wide reflecting that 2017-2022 saw high industry losses from natural catastrophes.
The capital destruction effect of these losses was exacerbated in 2022 by the rise in bond yields — which hurt the asset portfolios of reinsurers — which further reduced capital availability. As a result, spreads widened dramatically in 2023 to attract new capital, and they remain very attractive in 2025, even as spreads on high yield bonds have at times lurked near pre-GFC lows.
The key point here is that the probability of expected loss hasn’t changed materially over this period, but the expected return (and reinsurance spread above cash) has more than doubled since 2017.
This is illustrated in Chart 1, which shows the expected loss on MLC’s ILS strategy has remained roughly similar at 2%-3% per annum, while the expected return has increased to 15% at the start of 2025. Even after accounting for expected losses, the net expected return of 12% is highly attractive for a diversifying asset.
Chart 1: Evolution in expected loss and return — MLC ILS strategy
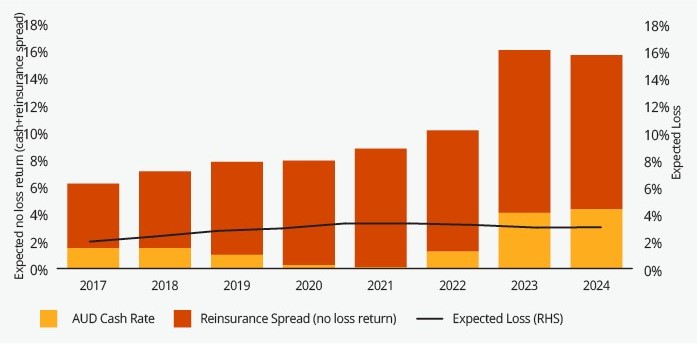
Source: MLC
Secondly, within mainstream asset classes the market is pretty efficient at pricing risk. Similarly, within asset classes, the market is pretty efficient at pricing risk. For example, within corporate debt the spreads on AMC Entertainment’s high yield bonds might be 700 basis points due to the significant risks facing the cinema industry post-COVID and the rise of streaming, while spreads on Apple’s investment grade bonds might be ~100 basis points reflecting the company’s cash cow status and associated much lower risk.
However, if we look within the ILS asset class, we find that different perils pay very different returns for a very similar probability of loss. Chart 2 takes two cat bonds issued in 2025: Palm Re provides cover against losses from Florida wind events while Sakura Re covers Japanese wind and flood.
Chart 2: A tale of two cat bonds
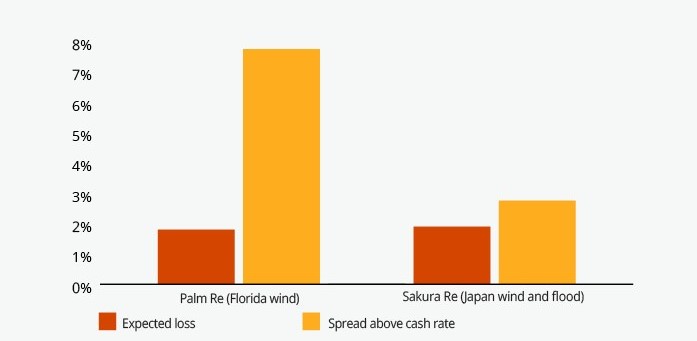
Source: Artemis data derived from Offering Circulars, MLC
While the expected loss on each bond is roughly the same, the reinsurance spread on Palm Re is nearly 3x that of Sakura Re. This is the type of anomaly hiding in plain sight that doesn’t exist in mainstream markets.
Why does it exist in ILS?
The US is the largest market globally for home insurance and reinsurance. Additionally, within the US there is a concentration of insured real estate in states that are heavily exposed to natural catastrophe events, namely Florida (hurricanes) and California (earthquake and wildfire).
As a result, reinsurers have a concentration risk in US property catastrophe risks (which are often 20-40% of their total portfolio), with Florida being a key concentration within the US.
The implication for ILS investors is straightforward. For a reinsurer, every incremental dollar of exposure to Florida hurricane risk reduces diversification, increasing overall risk while for a capital market investor adding Florida hurricane risk to a multi-asset class portfolio increases diversification leading to better risk-adjusted returns. For ILS investors, concentrating risk in higher paying peak perils is arguably a ‘no brainer’.
2. Remote risks: The economic and behavioural logic
Chart 3 illustrates a typical ‘insurance tower’. As homeowners know, the initial losses are retained by the policyholder, the pesky ‘excess’ we must pay before the insurer steps in.
The insurer generally retains the next layer of exposure up to a point at which they choose to buy reinsurance (~$400 million in Chart 3). There are then several layers (the tower below is a simplified example) of reinsurance.
Layer 1 pays higher premiums to the reinsurer for taking the higher ‘closer to the money’ risk. Layer 3 pays lower premiums for more ‘remote risks’ (i.e. lower probability of being impacted).
Chart 3: Insurance tower
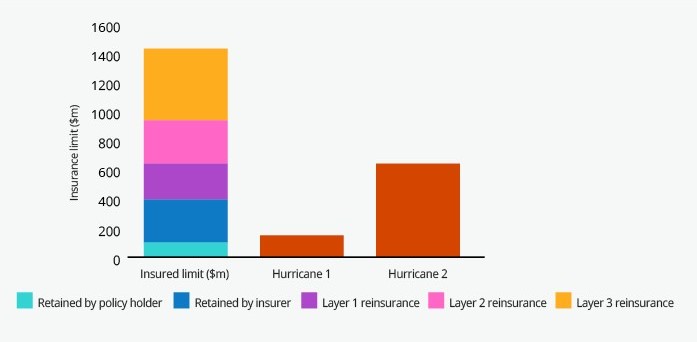
Source: MLC
The size of the natural catastrophe event then determines who bears losses and how much. For example, hurricane 1 wouldn’t see any losses to reinsurers, while hurricane 2 would see layer 1 wiped out, and layers 2 and 3 not impacted.
Our focus over time has been on taking exposure to the more ‘remote risks’. There are three reasons for this. The first is that the absolute returns for taking these ‘remote risks’ have been attractive — our strategy has generated cash+5% per annum over 18 years after all losses and the current expected return (after expected losses of 3%) is 12% for 2025. We haven’t felt the need to reach for more yield.
Secondly, the return per unit of risk (defined as expected loss, or EL) has been higher as illustrated by Chart 4.
Chart 4: Remote risks pay a higher return per unit of risk
US reinsurance market pricing by EL band (January 2023 renewals)
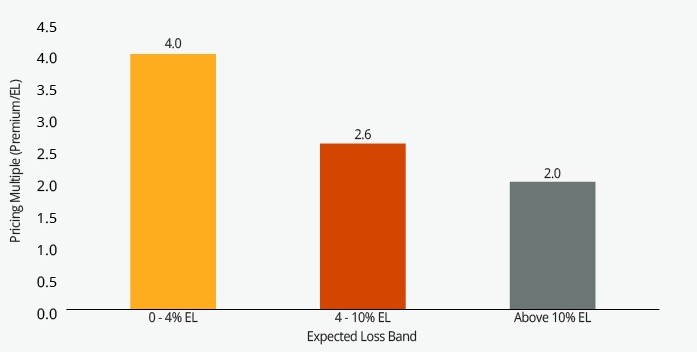
Source: MLC
One of the benefits of this focus on more remote risks is that we can both benefit from the higher returns available in peak perils, like Florida hurricane, and still deliver palatable returns even if there are major Florida hurricanes. For example, the MLC strategy was positive in both 2017 with Hurricane Irma (estimated industry losses US$20 billion) and Hurricane Milton (estimated industry losses US$25 billion).
The third reason, which is really important, is the behavioural dynamics. If there is a large industry loss then reinsurance premium rates tend to rise — making it a more attractive time to allocate.
Those investors who suffer big losses from the event can be less able to stay the course and remain invested due to increased stakeholder risk aversion. This can manifest in heightened concerns around ‘climate change’ or ‘maybe the models are wrong’. To be clear, both of these are legitimate concerns and it’s wise to factor in any information contained in each catastrophe, but the risk is the response is amplified by the emotions that come from suffering losses.
Chart 5 illustrates how MLC’s strategy, as an example of a more remote risk focused portfolio, outperformed the broader global peer group over the 2017-2022 period.
Chart 5: Outperformance during challenging periods
MLC ILS strategy versus objectives and peers
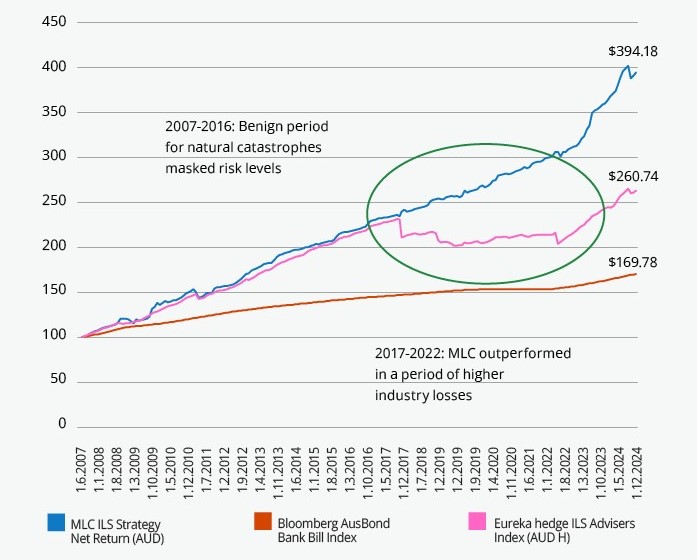
Source: Bloomberg, Eurekahedge, MLC
A key benefit of this was that internal stakeholder support for the strategy remained high and allocations were able to increase as premium rates increased significantly in January 2023.1
3. Private reinsurance and cat bonds: “Por que no los dos”
A common question is whether to invest in cat bonds or private reinsurance. There are pros and cons of both. Chart 6 summarises some of the characteristics of the different access points within ILS.
Chart 6: Overview of different ways to access ILS exposure
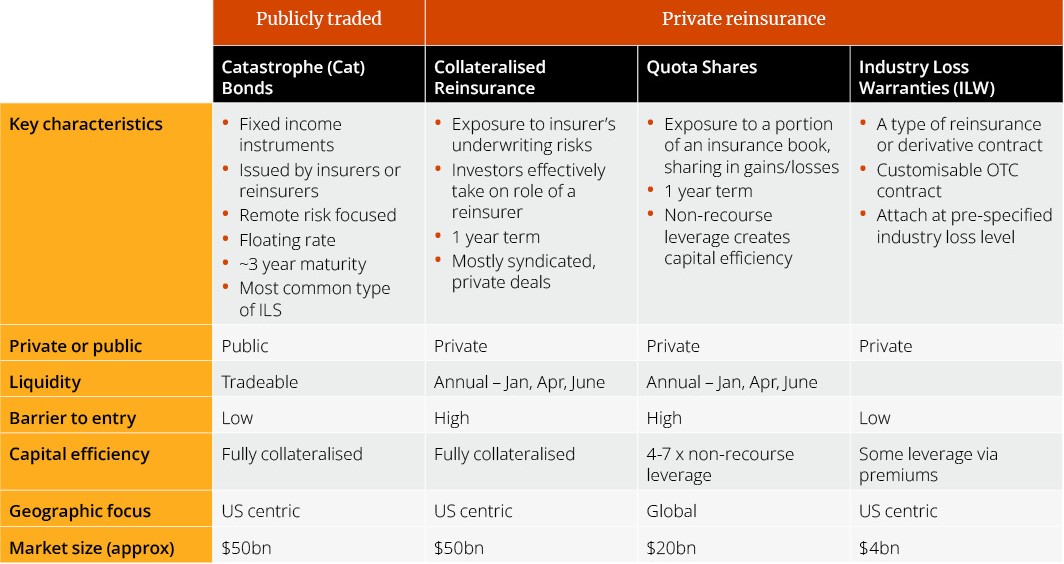
Source: MLC
Our perspective is aligned with Old El Paso’s famous ad about whether to choose soft or hard tacos — “Por que no los dos?” — why not have both? The reality is the relative value and the performance (as well as the inefficiencies and risk characteristics) of these different sub-sectors of the market will vary through time. So having exposure to both private and public reinsurance creates more flexibility to optimise portfolio outcomes.
For example, our view in early 2023 was that it was an attractive time to rotate more into cat bonds as spreads were very wide, and one of the distinctive features of cat bonds is that they have 2-3-year durations versus 1-year annual contracts in the private reinsurance market.
Locking in the higher yields and the spread duration created the scope for capital gains if yields reduced, as they have done. Conversely, if we look at relative value today, our strategy is ~85% in private reinsurance (a combination of quota shares and collateralised private reinsurance) and 15% in cat bonds.
The spread above cash of ~10% in our strategy compares to ~6% on cat bonds (May 2025) for a similar level of expected loss. This is anomalously high relative to history, but underscores the benefit of being able to allocate across both private and public markets.
4. Why luck dominates skill and the implications for manager selection.
We think one of the most under-estimated risks in the asset class is manager selection and portfolio design. It is intuitive for investors exploring ILS to perceive the asset class as ‘alternative beta’ and so form the view that the optimal strategy is to access this ‘beta’ as fee efficiently as possible.
Additionally, given it’s a relatively small asset allocation for most investors, from a resource efficiency perspective, it’s common to go with a single manager (even though that’s unlikely to be the right approach in virtually any other asset class). The risk of this approach is that in ILS the nuances of portfolio implementation matter a lot and can drive big divergences in manager performance.
In Chart 7 we share some analysis we did of 15 ILS managers2 between 2017-2023. All of these managers were taking roughly similar levels of risk.3 This period is instructive because it was a period of relatively high insured losses, which allows differential performance to emerge (compared to a benign period of no losses when all managers will earn roughly their premium income).
Chart 7: Manager dispersion risks in ILS
Annual returns (USD)
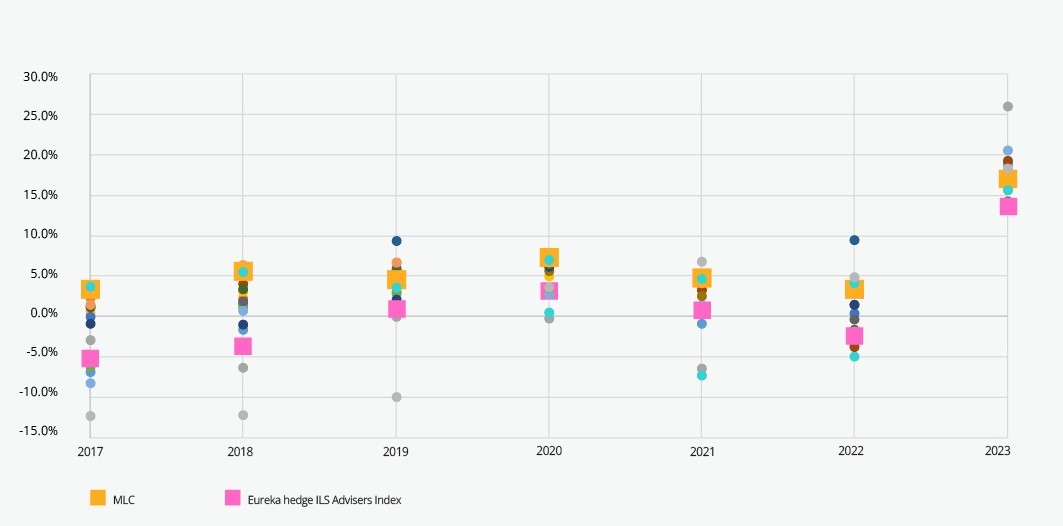
Source: Eureka hedge, MLC
The results are striking. The deviation between the best and worst performance in each annual period varied between a low of 8% in 2020 and a high of nearly 20% in 2018. The average deviation between the best and worst manager over these 7 years was 15% per annum.
There are many reasons for this. Firstly, there is a long list of portfolio management decisions that will lead to distinctive exposures that will drive performance differentials (even with a similar starting expected loss). A non-exhaustive list of these would include:
- Level of remote vs non-remote risks
- Peak versus non-peak perils
- Private reinsurance versus cat bonds
- Within private reinsurance, quota shares versus collateralised reinsurance
- Reinsurance versus retrocession (reinsurance of reinsurance)
- Aggregate versus per occurrence contracts
- Level of cedant (insurance counterparty) diversification
- Choice and performance of cedants
- Portfolio risk parameters and constraints
- Risk modelling and adjustments versus independent models
- Portfolio optimisation
Secondly, one of the distinctive characteristics of ILS is that the majority of the risk is driven by infrequent and unpredictable catastrophe events. This means that a reinsurer or ILS manager may be skilled in choosing to write a particular risk or counterparty because it was mispriced probabilistically, but if they happen to do so in the year when that low probability event hits that contract, their performance will be hit i.e. they will have been ‘wrong for the right reasons.’ In other words, while skill matters, luck can dominate skill in this asset class.
Our conclusion is that the best way to ameliorate this risk is via a diversified multi-manager strategy. The risk of not doing this, is that you get unlucky with manager selection and — an additional and bigger risk — this coincides with a tough year for the asset class. This likely means heightened stakeholder attention and increases the risk of not being able to participate in ILS when spreads are extremely attractive — as is currently the case.
Conclusion: Staying in the game — the importance of resilience
Perhaps the most important lesson of all that we’ve learned is this; the best way to win in ILS is to stay in the game. That means:
- Diversification matters. Allocate capital across managers to avoid the risk of being unlucky and create more certainty that you’ll reliably capture the attractive ‘alternative beta’ over the long‑term.
- The devil is in the detail. Nuance of portfolio design matters a lot and considering peril and instrument exposures is key.
- Play the long game. Have a clear thesis for being in the asset class that is shared by key stakeholders that enables you to collectively navigate the inevitable losses.
- Accept that losses will occur. This is the risk we’re being paid to take, but ensure that they are manageable and that ideally you can add exposure when premiums are higher after large events
Our view is definitively that ILS is not a “set and forget” asset class. Hopefully, we have shared some useful insights regarding some (albeit not all) of the key nuances. They matter – individually and even more so when added together. They are worth attuning to as they can make a big difference in determining how much of this uniquely uncorrelated risk premium investors capture.
Sources:
1 This is not to say this approach will always be the right one – if remote risks become overbid and lower layers become more attractive on a risk-adjusted basis, then it may make sense to make a smaller capital allocation to a higher risk ILS portfolio.
2 These are all well credentialed managers and were chosen based on availability of data i.e. they weren’t cherry picked to maximise dispersion.
3 Stated expected losses of between 1.5-4%. In a future article, we will talk through some of the key nuances in how to determine expected loss and why one manager’s “2% expected loss” and be different to someone else’s “2% expected loss”. The key point is that it’s not an exact science, so having a band of 1.5-4% is a reasonable proxy for ‘similar’ risk levels.
Important information
This communication is issued by MLC Investments Limited ABN 30 002 641 661 AFSL 230705 (MLCI), in its capacity as responsible entity and trustee of the various funds issued by it. It is intended for financial advisers and wholesale clients only, and must not be distributed to ‘retail clients’ as defined in the Corporations Act 2001 (Cth). MLCI is part of the Insignia Financial group of companies comprising Insignia Financial Ltd ABN 49 100 103 722 and its related bodies corporate (Insignia Financial Group).
The information and commentary provided in this communication is of a general nature only and does not relate to any specific fund or product issued by an Insignia Financial Group entity. The information does not take into account any particular investor’s personal circumstances and reliance should not be placed by anyone on the information in this communication as the basis for making any investment decision. Before acting on the information, you should consider the appropriateness of it having regard to your personal objectives, financial situation and needs. You should consider the relevant Product Disclosure Statement (PDS) and Target Market Determination (TMD), available from the applicable Insignia Financial Group website or by calling us, before deciding to acquire or hold an interest in a financial product issued by an entity within the Insignia Financial Group.
Past performance is not a reliable indicator of future performance. The value of an investment may rise or fall with the changes in the market. Actual returns may vary from any target return described and there is a risk that the investment may achieve lower than expected returns.
No company in the Insignia Financial Group guarantees the repayment of capital or the performance of an investment, unless expressly stated in a PDS. Any investment is subject to investment risk, including possibly delays in repayment and loss of income and principal invested.
Any opinions expressed constitute our judgement at the time of issue and are subject to change without notice. We believe that the information contained in this communication is correct and that any estimates, opinions, conclusions or recommendations are reasonably held or made at the time of compilation. However, no warranty is made as to their accuracy or reliability or in respect of other information contained in this communication. Any projection or forward-looking statement (Projection) in this communication is provided for information purposes only. No representation is made as to the accuracy or reasonableness of any such Projection or that it will be met. Actual events may vary materially.
This communication is directed to and prepared for Australian residents only.