August 2026 |  14 min read | Download PDF
Dan Farmer, Chief Investment Officer
My previous commentary explored the recent struggles of active global equity managers to outperform their benchmarks. Completing the arc, this note turns to active Australian equity managers who, like their global counterparts, have also endured an unusually difficult period.
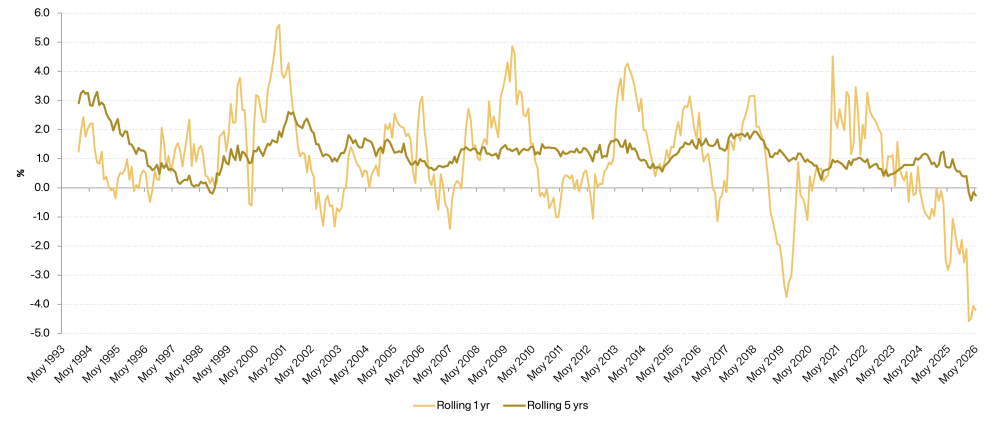
The underperformance of active Australian equity managers since early 2025 has been the most severe in more than three decades, eclipsing even the difficult 2018-19 period (Chart 1). Intriguingly, both episodes coincided with Donald Trump’s presidency.
Moreover, for the first time since the late-1990s technology bubble, the median active Australian equity manager has underperformed over a rolling five-year period.
Chart 1: The recent past has been particularly difficult for active Australian equity managers
Median Australian Share Manager Performance vs the S&P/ASX 300 Index: Rolling 1- and 5-year excess returns to 31 May 2026
Sources: MercerInsight MPATM 31 May 2026
Past performance is not a reliable indicator of future performance
Such periods invariably invite challenging questions about the value of active management itself. Yet we would caution against knee jerk reactions from what has been an unusually narrow and structurally distorted market environment.
Recent market outcomes have unfolded against an unusual backdrop of trade disruption, geopolitical tensions and energy-price volatility. Global supply chains that took decades to build have been reshaped in a comparatively short period.
Businesses have had to contend with shifting trade arrangements, fluctuating input costs and uncertainty around future demand. These conditions have created an environment in which a relatively small number of companies and themes have dominated market returns.
History provides perspective
Active Australian equity managers have delivered strong outperformance over sizeable periods during the past three decades. Likewise, previous episodes of underperformance have ultimately been succeeded by recoveries (Chart 1), and we remain confident this cycle will prove no different. While no two periods are identical, markets have repeatedly demonstrated a tendency to rotate away from crowded positions and back towards underlying fundamentals.
As we see it, walking away from active Australian equity management now risks missing a potentially powerful performance rebound.
The intellectual case for active management is well understood. Markets are shaped not only by fundamentals, but also by optimism and fear, fashion and fatigue. These forces can push companies’ share prices meaningfully away from intrinsic value for extended periods creating opportunities for active managers.
Skilled active managers can add value over time in ways that passive investing, for all its merits, is not designed to exploit. Passive strategies provide market exposure efficiently and at low cost. Active managers, by contrast, aim to identify mispriced securities, avoid areas of excessive optimism, and allocate capital toward companies where future prospects are not fully reflected in current valuations.
The challenge is that there are periods when markets reward concentration, liquidity and narrative over valuation discipline and stock dispersion. The past 12–18 months have been one of those periods.
Trump-era parallels and a narrow market
The earlier episode of active manager underperformance during 2018–19 (Chart 1) emerged against the backdrop of escalating US-China trade tensions. Markets became increasingly unsettled as the Trump administration ratcheted up tariffs and strategic competition with China.
The more recent period has, in many respects, been a louder and more disorderly repeat. In early April 2025, the United States imposed sweeping tariffs on much of the world under what became known as “Liberation Day”.1
Australia’s equity market, narrow and highly concentrated by global standards, proved especially vulnerable to fears of slowing global trade and weaker Chinese demand.
The Big Four banks, large resource companies (BHP, Rio Tinto, and Fortescue), and dominant consumer franchises (Woolworths and Coles) represent disproportionately large parts of their sectors and a significant share of the S&PASX 300 Accumulation Index’s (ASX 300) performance.
This proved particularly challenging for active managers because returns were narrow rather than broad-based.2 Liquidity and index size were rewarded; stock selection was not.3
The distinction matters.
Active managers typically underweight large-capitalisation (large-cap) index heavyweights for valuation as well as risk-management reasons. When a small number of dominant stocks account for a disproportionate share of index returns, even well-researched portfolios can lag benchmarks for extended periods.
The performance of our active Australian equity strategies has been impacted through this dynamic, in part due to underweight positions in large cap companies, such as the Big Four banks, which we deem to be expensive, and heavyweight resources companies benefiting from their stalwart status driven by extensive institutional research coverage.
Overweighting healthcare stocks also detracted from performance as two of our holdings, ResMed and Fisher & Paykel Healthcare, experienced share-price weakness. We continue to believe in the longer-term outlook for both businesses, which we discuss in more detail later in this note.
Midcap overweighting has been a detractor
The flip side of our managers’ decision to underweight the large-cap end of the market has been their modest overweight position in the S&P/ASX MidCap 50 Index (MidCap 50) and, to a lesser extent, the S&P/ASX Small Ordinaries Index (Small Ordinaries).
They believe these segments provide a broader and more diverse opportunity set than the large-cap dominated ASX 300. The opportunity set is not simply larger in number. It is also richer in terms of business models, industry exposures and growth pathways.
In both indices, but particularly in the mid-cap universe, our managers have leaned into what they regard as quality industrial companies exhibiting strong return-on-equity, healthy cash generation and durable profitability.
Our managers, and we, regard the mid-cap segment as a compelling long-term source of alpha, supported by stronger structural earnings growth, greater return dispersion and lower analyst coverage than large caps. These characteristics increase the scope for company-specific research to add value and reduce the extent to which returns are determined by benchmark weightings alone.
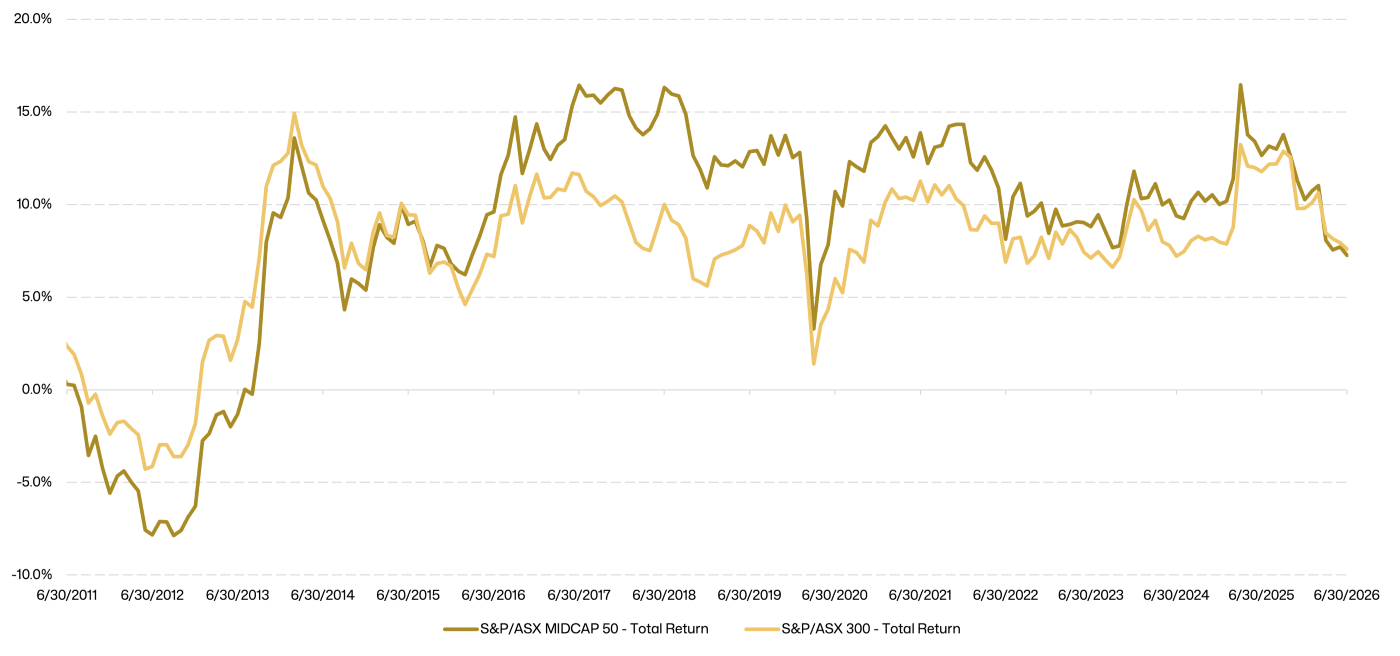
Evidence over two decades broadly supports this proposition. The MidCap 50 has outperformed the ASX 300 for significant stretches over rolling five-year periods, interrupted by occasional periods of convergence, such as today (Chart 2). This, in our view, underscores the atypical nature of the current cycle and the MidCap 50’s recent underperformance against the ASX 300.
Chart 2: The MidCap 50 has generally delivered strong total returns over two decades
ASX MidCap 50 vs ASX 300 (Rolling 5-year periods: 30 April 2006 – 30 June 2026)
Source: FactSet financial data and analytics, MLC Asset Management as at 30 June 2026
Past performance is not a reliable indicator of future performance
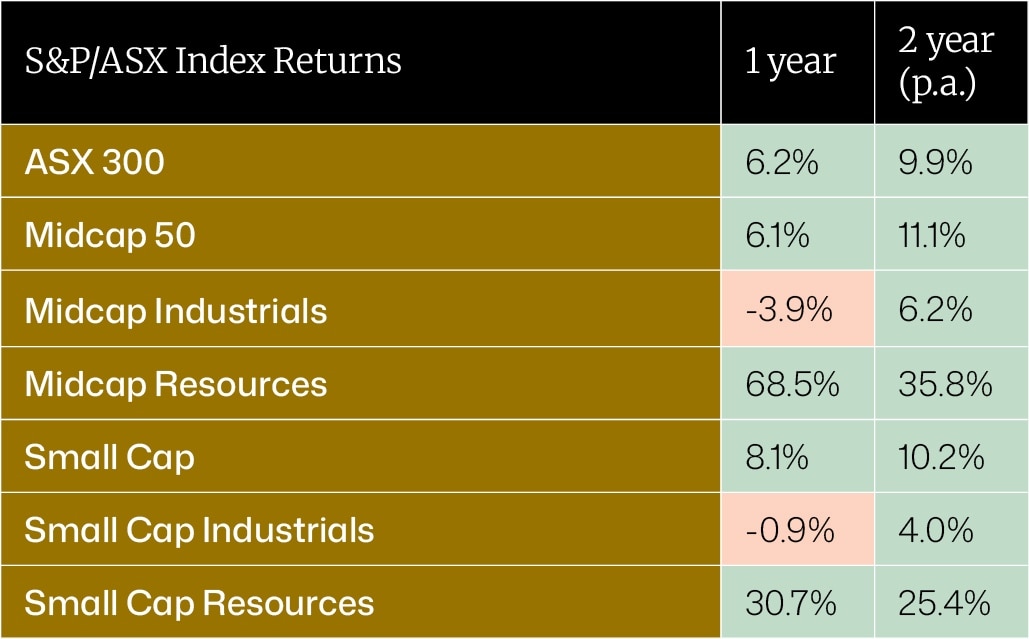
Further decomposition of performance reveals that weak returns from the ASX Midcap Industrials Index (within the ASX Midcap Index), explains much of the recent underperformance relative to the ASX 300 (Chart 3). Industrial companies within the Small Ordinaries Index also struggled, suggesting a common headwind across the sector.
The simple explanation is that investors ignored industrials and rushed towards resources across both indices: one-year returns were eye-popping while two-year returns were impressive (Chart 3). Given our industrials tilt, this helps explain our recent underperformance.
Chart 3: The ASX Midcap Industrials has underperformed the broad market
S&P/ASX index returns for periods to 30 June 2026
Source: FactSet, MLC Asset Management as at 30 June 2026
Past performance is not a reliable indicator of future performance
While underperformance is never taken lightly, our managers’ investment thesis underpinning the pro industrials bias remains intact. This area continues to offer what they regard as a more diversified and durable opportunity set, with a focus on companies exhibiting resilient, profitable business models.
By contrast, many mid- and small-cap resource companies are concentrated in a single commodity and are therefore inherently higher risk. Moreover, we do not think that their recent dramatic share price gains are sustainable. Eventually, economic gravity will do its work and pull back these companies’ valuations.
Nevertheless, recent enthusiasm for smaller resource companies has undoubtedly detracted from our returns. That said, history and our experience suggest commodity cycles are ultimately self-correcting.
High commodity prices induce new supply from higher cost producers, typically resulting in supply overshooting, which then dents prices. Recent price moves in gold, lithium and selected energy-transition commodities provide useful examples. The relative lack of interest in industrial businesses with sizeable offshore earnings has also been notable. Many have been disadvantaged by the Australian dollar’s strength despite continuing to perform well operationally.
As Australia’s interest-rate cycle appears to be peaking, we believe quality industrial companies may begin to attract greater attention. A stabilisation in interest rates and currency markets would likely remove some of the headwinds that have weighed on sentiment toward these businesses.
Consequently, we remain confident investors will eventually place greater emphasis on valuation and business quality, creating a more supportive environment for quality industrial companies.
Making sense of banks, and high beta resource companies’ strong performance
Market participants’ support for banks and high beta resource companies may appear difficult to reconcile. We think it is better understood as a barbelled response to uncertainty.
On one side, index-driven and benchmark-aware capital gravitated toward the largest, most liquid names, most notably the banks, reflecting both their dominant weight in the ASX 300 and their perceived defensive characteristics. In periods of volatility, these flows often reflect a search for liquidity, yield and benchmark alignment.
At the same time, investors sought leveraged exposure to elevated commodity prices through smaller resource companies. In an environment shaped by tariffs, deglobalisation and geopolitical tension, mid and smaller resource companies offered a highly leveraged way to express a view on scarcity and supply constraints.
Taken together, these dynamics reflect distinct expressions of risk rather than a single coherent market view. One side of the market prioritised stability and liquidity. The other sought thematic exposure to commodity scarcity. Both benefited from the unusual conditions that characterised the past year.
Healthcare: another lens on the underperformance of quality investment factors
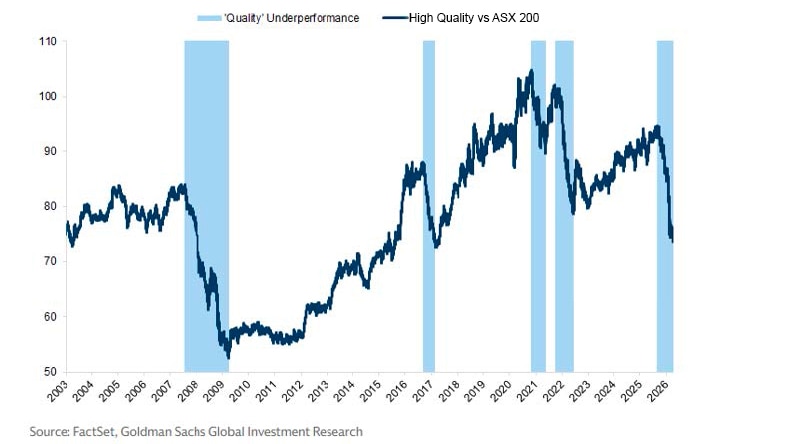
The out-of-favour status of quality industrials companies is not confined to those lower down the market capitalisation ladder. Since mid-2025, the quality factor has underperformed the S&P/ASX 200 Index by around 22%,4 making this one of the most difficult periods for quality investing in two decades (Chart 4).
Chart 4: The current ‘quality’ underperformance is the third worst episode in the past 20 years
Periods when the ‘quality’ factor underperformed the market by >15%
Past performance is not a reliable indicator of future performance
Note: Relative performance of a ‘High Quality’ basket versus the ASX 200. Shaded periods in the chart reflect episodes where the quality factor lagged the market by more than 15%.
What makes the period notable is that many of the companies caught in the downdraft remain fundamentally strong businesses. What changed was not necessarily business quality, but investors’ willingness to pay premium valuations for stability and predictability.
This is encapsulated by two healthcare companies in our portfolios — ResMed, and Fisher & Paykel Healthcare. Both experienced meaningful share-price declines despite retaining attractive long-term characteristics.
ResMed’s share price retreated following positive clinical-trial results for a competing oral sleep-apnoea therapy.5 Fisher & Paykel Healthcare, which is exposed to similar themes, has also been impacted by a combination of slower growth expectations and company specific factors.6
Looking ahead, it’s reasonable to argue that both companies retain strong competitive positions. Current evidence suggests pharmaceutical therapies are likely to complement rather than fully replace device-based treatments, supporting the longer-term outlook for these businesses.
In our view, periods such as this often create opportunities for patient investors. When high-quality companies experience significant valuation compression despite relatively stable fundamentals, future return prospects can improve meaningfully.
That being the case, we can imagine value attentive investors looking at the likes of ResMed and Fisher & Paykel Healthcare, as well as fallen market darling CSL, with greater interest.
Technology companies have not been spared either.
Earlier this year, investors became increasingly concerned that generative and agentic AI could threaten the economics of established software providers, including two of our holdings, Life360 and TechnologyOne.
Since then, more measured assessments have emerged. A growing consensus is that AI will function as a productivity layer that enhances enterprise software rather than replacing it outright. If that proves correct, performers in the technology realm that appear to be oversold may become increasingly attractive to active managers.
The rise of passive investing and its consequences
Recent events have also reignited debate around passive investing and the broader structure of equity markets.
Passive strategies have undoubtedly delivered enormous benefits for investors, including lower costs, greater accessibility and efficient diversification. They remain an essential component of portfolio construction.
However, the continued growth of passive investing has also altered market dynamics in important ways. As value-insensitive flows have grown, market behaviour has increasingly reflected index weightings and liquidity rather than underlying company fundamentals.7
This helps explain why large-cap stocks have attracted persistent inflows regardless of valuation, while smaller companies have struggled to command investor attention.
The effects are increasingly visible. Markets have become faster-moving, more concentrated and, at times, more mechanically driven.
Passive investing is also not quite as passive as the label implies. Index rebalancing, benchmark changes, inflows and redemptions all trigger buying and selling behaviour that can amplify market swings and reinforce momentum.
This does not invalidate passive investing. But it does suggest that market pricing may become increasingly disconnected from fundamental value over shorter periods.
Ironically, those same distortions may create future opportunities for value attentive investors. Price discovery may be slower in a market increasingly influenced by passive flows, but it has not disappeared. Ultimately, company earnings, cash flows and valuations still matter.
Is there hope on the horizon for active management?
These are undoubtedly difficult days for active investing. Yet history suggests caution against extrapolating recent outcomes indefinitely into the future. Pronounced periods of underperformance have often been followed by meaningful recovery (Chart 1).
Many of the forces that have driven recent underperformance like extreme concentration, narrow leadership and momentum-driven behaviour, are unlikely to persist forever. Market leadership eventually broadens. Valuation extremes narrow. Investor preferences shift.
Commonwealth Bank was briefly the world’s most expensive bank on a price-earnings basis8 but it has experienced a sharp share-price setback more recently. Other members of the Big Four banks have also declined, serving as a timely reminder that even the most crowded trades are not immune to mean reversion.
The banks sector fell 12.7% from its 20 February 2026 peak to 30 June 2026, while the technology sector rose by 20.6% from 30 March 2026 to 30 June 2026, and the healthcare sector gained 16.3% over the same period.9 While the timing of a broader shift towards mean reversion is inherently uncertain, we believe the opportunity set for active managers is already improving. Return dispersion across Australian companies has increased, creating a richer environment for stock selection.
The broader macroeconomic backdrop is also becoming more balanced. Inflation remains above target in many regions, but price pressures are easing and energy markets are less disruptive than they were.
Should these trends continue, interest rates are more likely to stabilise than rise materially. Such an environment would be supportive of many of the quality industrial, healthcare and technology companies held in our portfolios.
More broadly, a less distorted market environment would increase the importance of company fundamentals relative to market capitalisation and index membership. That shift would be welcome for active managers and for investors seeking exposure to a broader range of opportunities across the market.
The final word goes to Oaktree Capital founder Howard Marks, who observed: “Success carries within itself the seeds of failure, and failure the seeds of success.”
That observation feels particularly relevant today. The factors that have challenged active managers may ultimately create the conditions for their recovery. While the timing of that recovery remains uncertain, we believe the case for active management remains intact and that the environment ahead may prove considerably more favourable than the one endured by investors over the past eighteen months.
2 Active management outcomes in the 2025 financial year - Frontier Advisors, 8 September 2025
3 Ibid
4 Goldman Sachs Research, Quality at a more reasonable price, Portfolio Strategy Research 13 April 2026
5 ResMed (ASX: RMD) Shares Fall Amid Competitive Pressure From Emerging OSA Drug Candidate, Team Kalkin, 20 May 2025
7 Macquarie Capital. Vantage 2025: Overview and outlook, https://www.macquarie.com/au/en/insights/macquarie-capital-vantage.html
8 The world’s most expensive bank reports earnings, Morningstar, 21 August 2024
9 FactSet
Important information
This communication is issued by MLC Investments Limited ABN 30 002 641 661 AFSL 230705, IOOF Investment Services Ltd ABN 80 007 350 405 AFSL 230703 and OnePath Funds Management Limited ABN 21 003 002 800 AFSL 238342 each in their capacity as responsible entity and trustee of the various funds issued by them. These entities are part of the Insignia Financial group of companies comprising Insignia Financial Ltd ABN 49 100 103 722 and its related bodies corporate (Insignia Financial Group). The Insignia Financial Group is ultimately controlled by CC Capital Partners LLC and its affiliates (a New York based private equity firm) and OneIM GP LLC and its affiliates (a London based private equity firm).
The information and commentary provided in this communication is of a general nature only and does not relate to any specific fund or product issued by an Insignia Financial Group entity. The information does not take into account any particular investor’s personal circumstances and reliance should not be placed by anyone on the information in this communication as the basis for making any investment decision. Before acting on the information, you should consider the appropriateness of it having regard to your personal objectives, financial situation and needs. You should consider the relevant Product Disclosure Statement (PDS) and Target Market Determination (TMD), available from the applicable Insignia Financial Group website or by calling us, before deciding to acquire or hold an interest in a financial product issued by an entity within the Insignia Financial Group.
Past performance is not a reliable indicator of future performance. The value of an investment may rise or fall with the changes in the market. Actual returns may vary from any target return described and there is a risk that the investment may achieve lower than expected returns.
No company in the Insignia Financial Group guarantees the repayment of capital or the performance of an investment, unless expressly stated in a PDS. Any investment is subject to investment risk, including possibly delays in repayment and loss of income and principal invested.
Any opinions expressed constitute our judgement at the time of issue and are subject to change without notice. We believe that the information contained in this communication is correct and that any estimates, opinions, conclusions or recommendations are reasonably held or made at the time of compilation. However, no warranty is made as to their accuracy or reliability or in respect of other information contained in this communication. Any projection or forward-looking statement (Projection) in this communication is provided for information purposes only. No representation is made as to the accuracy or reasonableness of any such Projection or that it will be met. Actual events may vary materially.
This communication is directed to and prepared for Australian residents only.


